문제
- 자전거 대여 수요 예측
- 자전거를 대여하는 Count 값을 예측하는 Regression 문제
- 데이터
Bike Sharing Demand
답안 코드 보기 전 내가 먼저 접근해보기
- 접근 목표
- 선형 회귀, 트리 기반 회귀 성능 비교
- pipeline을 통해 표준정규분포화, linearRegression 학습까지 동시에 진행
- 점수 산출은 rmse로! 주의해야 할 점은 rmse로 할 때 cross_val_score는 neg를 꼭 붙여줘야함
- 접근하면서 의문점
- Null값 없음을 확인한 후 모든 컬럼을 standartscaler를 활용해 표준정규분포화 하려고 하는데, datetime의 데이터타입이 object라서 제대로 fit 함수가 안돌아감. 그렇다고 datetime을 버리자니 자전거 수요예측과 기간의 관련성이 있을것 같아서 버리기 아쉬움
- DataFrame.sort_values()로 해결함. Series타입만 sort 가능한 줄 알았는데 그냥 데이터프레임에도 sort_values를 적용할 수 있었네
- Null값 없음을 확인한 후 모든 컬럼을 standartscaler를 활용해 표준정규분포화 하려고 하는데, datetime의 데이터타입이 object라서 제대로 fit 함수가 안돌아감. 그렇다고 datetime을 버리자니 자전거 수요예측과 기간의 관련성이 있을것 같아서 버리기 아쉬움
- 선형 회귀, 트리 기반 회귀 성능 비교
답안 코드 공부 후 피드백
- datetime, timedate처럼 시간 관련 데이터는 굉장히 많이 나옴
- 이를 판다스의 datetime 데이터 타입으로 변경해서 접근하면 좋을때가 많음
- 카테고리형 데이터는 따로 전처리 해줘야함
- 카테고리형 데이터는 값이 커지거나 했을 때 값이 커졌으니 주목해야한다 같은 개념이 아님(ex. 2012년, 2013년)
- 판다스의 get_dummies()를 이용해서 원핫인코딩 처리를 해주면 선형 회귀 모델 성능 향상에 도움을 줌
- 카테고리형 데이터는 값이 커지거나 했을 때 값이 커졌으니 주목해야한다 같은 개념이 아님(ex. 2012년, 2013년)
import numpy as np
import pandas as pd
raw = pd.read_csv('./bike_train.csv')

print(raw.shape)
raw.head()
(10886, 12)
| datetime | season | holiday | workingday | weather | temp | atemp | humidity | windspeed | casual | registered | count | |
|---|---|---|---|---|---|---|---|---|---|---|---|---|
| 0 | 2011-01-01 00:00:00 | 1 | 0 | 0 | 1 | 9.84 | 14.395 | 81 | 0.0 | 3 | 13 | 16 |
| 1 | 2011-01-01 01:00:00 | 1 | 0 | 0 | 1 | 9.02 | 13.635 | 80 | 0.0 | 8 | 32 | 40 |
| 2 | 2011-01-01 02:00:00 | 1 | 0 | 0 | 1 | 9.02 | 13.635 | 80 | 0.0 | 5 | 27 | 32 |
| 3 | 2011-01-01 03:00:00 | 1 | 0 | 0 | 1 | 9.84 | 14.395 | 75 | 0.0 | 3 | 10 | 13 |
| 4 | 2011-01-01 04:00:00 | 1 | 0 | 0 | 1 | 9.84 | 14.395 | 75 | 0.0 | 0 | 1 | 1 |
raw.info()
<class 'pandas.core.frame.DataFrame'>
RangeIndex: 10886 entries, 0 to 10885
Data columns (total 12 columns):
 #   Column      Non-Null Count  Dtype
---  ------      --------------  -----
 0   datetime    10886 non-null  object
 1   season      10886 non-null  int64
 2   holiday     10886 non-null  int64
 3   workingday  10886 non-null  int64
 4   weather     10886 non-null  int64
 5   temp        10886 non-null  float64
 6   atemp       10886 non-null  float64
 7   humidity    10886 non-null  int64
 8   windspeed   10886 non-null  float64
 9   casual      10886 non-null  int64
 10  registered  10886 non-null  int64
 11  count       10886 non-null  int64
dtypes: float64(3), int64(8), object(1)
memory usage: 1020.7+ KB
raw.describe()
| season | holiday | workingday | weather | temp | atemp | humidity | windspeed | casual | registered | count | |
|---|---|---|---|---|---|---|---|---|---|---|---|
| count | 10886.000000 | 10886.000000 | 10886.000000 | 10886.000000 | 10886.00000 | 10886.000000 | 10886.000000 | 10886.000000 | 10886.000000 | 10886.000000 | 10886.000000 |
| mean | 2.506614 | 0.028569 | 0.680875 | 1.418427 | 20.23086 | 23.655084 | 61.886460 | 12.799395 | 36.021955 | 155.552177 | 191.574132 |
| std | 1.116174 | 0.166599 | 0.466159 | 0.633839 | 7.79159 | 8.474601 | 19.245033 | 8.164537 | 49.960477 | 151.039033 | 181.144454 |
| min | 1.000000 | 0.000000 | 0.000000 | 1.000000 | 0.82000 | 0.760000 | 0.000000 | 0.000000 | 0.000000 | 0.000000 | 1.000000 |
| 25% | 2.000000 | 0.000000 | 0.000000 | 1.000000 | 13.94000 | 16.665000 | 47.000000 | 7.001500 | 4.000000 | 36.000000 | 42.000000 |
| 50% | 3.000000 | 0.000000 | 1.000000 | 1.000000 | 20.50000 | 24.240000 | 62.000000 | 12.998000 | 17.000000 | 118.000000 | 145.000000 |
| 75% | 4.000000 | 0.000000 | 1.000000 | 2.000000 | 26.24000 | 31.060000 | 77.000000 | 16.997900 | 49.000000 | 222.000000 | 284.000000 |
| max | 4.000000 | 1.000000 | 1.000000 | 4.000000 | 41.00000 | 45.455000 | 100.000000 | 56.996900 | 367.000000 | 886.000000 | 977.000000 |
from sklearn.pipeline import Pipeline
from sklearn.linear_model import LinearRegression
from sklearn.ensemble import RandomForestRegressor
from sklearn.preprocessing import StandardScaler
from sklearn.model_selection import train_test_split
from sklearn.model_selection import GridSearchCV, cross_val_score

# datetime object형 데이터 타입을 int형으로 변경하자
raw.sort_values(by='datetime', ascending=True)  # 시간순으로 안되어 있을 수 있으니 시간순으로 정렬
raw.reset_index(inplace=True)
raw.rename(columns={'index': 'time'}, inplace=True)
raw.drop(columns='datetime', inplace=True)

# make pipeline
pipes = Pipeline([('standard', StandardScaler()), ('linear', LinearRegression())])


# # make train, test data

features = raw.iloc[:, :-1]
target = raw.iloc[:, -1]

X_train, X_test, y_train, y_test = train_test_split(features, target)       # 처음에 stratify = target으로 설정했었는데 회귀니까 stratify 하면 안될듯. 이건 분류에 쓰이는 것임

# pipes.fit(X_train, y_train)
def get_rmse_score(estimator, train_features, test_features, train_targets, test_targets):
    scores = cross_val_score(estimator, train_features, train_targets, scoring='neg_mean_squared_error', cv=5)
    scores = np.sqrt(-1 * scores)
    print(f'cv=5를 통해 나온 rmse 값: {scores}')

    estimator.fit(train_features, train_targets)        # 위의 cross_val_score만 해주면 estimator가 fit이 완료된것으로 생각했는데 아니였음. 코드로 직접 진행해줘야함
    pred = estimator.predict(test_features)
    scores = mean_squared_error(test_targets, pred)
    scores = np.sqrt(scores)
    print(f'test 데이터를 통해 나온 rmse 값: {scores}')

    print(type(test_targets))
    df = pd.DataFrame(data = test_targets.values, columns=['real_count'])       # 그냥 Series 타입인 test_target을 data로 넣었더니 데이터가 안들어갔음. numpy-array 형태로 넣어줬더니 됨. Series에는 index 정보까지 있어서 그런건가..
    df['pred'] = pred
    df['diff'] = df['pred'] - df['real_count']
    print(f'실제값, 예측값, 차이{df}')
get_rmse_score(pipes, X_train, X_test, y_train, y_test)
cv=5를 통해 나온 rmse 값: [142.43089727 139.14456407 144.49860883 144.60685959 140.06405343]
test 데이터를 통해 나온 rmse 값: 140.89958867165467
<class 'pandas.core.series.Series'>
      real_count
0            244
1            239
2            229
3            467
4            335
...          ...
3261           5
3262          12
3263          74
3264          62
3265         172

[3266 rows x 1 columns]
실제값, 예측값, 차이      real_count        pred        diff
0            244  320.786375   76.786375
1            239  251.187369   12.187369
2            229  241.709713   12.709713
3            467  388.818040  -78.181960
4            335  291.194551  -43.805449
...          ...         ...         ...
3261           5   49.036665   44.036665
3262          12  120.713426  108.713426
3263          74  315.231513  241.231513
3264          62  181.927374  119.927374
3265         172  166.290213   -5.709787

[3266 rows x 3 columns]
데이터 클렌징 및 가공
import numpy as np
import pandas as pd
import seaborn as sns
import matplotlib.pyplot as plt
%matplotlib inline

import warnings
warnings.filterwarnings("ignore", category=RuntimeWarning)

bike_df = pd.read_csv('./bike_train.csv')
print(bike_df.shape)
bike_df.head(3)
(10886, 12)
| datetime | season | holiday | workingday | weather | temp | atemp | humidity | windspeed | casual | registered | count | |
|---|---|---|---|---|---|---|---|---|---|---|---|---|
| 0 | 2011-01-01 00:00:00 | 1 | 0 | 0 | 1 | 9.84 | 14.395 | 81 | 0.0 | 3 | 13 | 16 |
| 1 | 2011-01-01 01:00:00 | 1 | 0 | 0 | 1 | 9.02 | 13.635 | 80 | 0.0 | 8 | 32 | 40 |
| 2 | 2011-01-01 02:00:00 | 1 | 0 | 0 | 1 | 9.02 | 13.635 | 80 | 0.0 | 5 | 27 | 32 |
bike_df.info()
<class 'pandas.core.frame.DataFrame'>
RangeIndex: 10886 entries, 0 to 10885
Data columns (total 12 columns):
 #   Column      Non-Null Count  Dtype
---  ------      --------------  -----
 0   datetime    10886 non-null  object
 1   season      10886 non-null  int64
 2   holiday     10886 non-null  int64
 3   workingday  10886 non-null  int64
 4   weather     10886 non-null  int64
 5   temp        10886 non-null  float64
 6   atemp       10886 non-null  float64
 7   humidity    10886 non-null  int64
 8   windspeed   10886 non-null  float64
 9   casual      10886 non-null  int64
 10  registered  10886 non-null  int64
 11  count       10886 non-null  int64
dtypes: float64(3), int64(8), object(1)
memory usage: 1020.7+ KB
# 문자열을 datetime 타입으로 변경.
bike_df['datetime'] = bike_df.datetime.apply(pd.to_datetime)

# datetime 타입에서 년, 월, 일, 시간 추출
bike_df['year'] = bike_df.datetime.apply(lambda x : x.year)
bike_df['month'] = bike_df.datetime.apply(lambda x : x.month)
bike_df['day'] = bike_df.datetime.apply(lambda x : x.day)
bike_df['hour'] = bike_df.datetime.apply(lambda x: x.hour)
bike_df.head(3)
| datetime | season | holiday | workingday | weather | temp | atemp | humidity | windspeed | casual | registered | count | year | month | day | hour | |
|---|---|---|---|---|---|---|---|---|---|---|---|---|---|---|---|---|
| 0 | 2011-01-01 00:00:00 | 1 | 0 | 0 | 1 | 9.84 | 14.395 | 81 | 0.0 | 3 | 13 | 16 | 2011 | 1 | 1 | 0 |
| 1 | 2011-01-01 01:00:00 | 1 | 0 | 0 | 1 | 9.02 | 13.635 | 80 | 0.0 | 8 | 32 | 40 | 2011 | 1 | 1 | 1 |
| 2 | 2011-01-01 02:00:00 | 1 | 0 | 0 | 1 | 9.02 | 13.635 | 80 | 0.0 | 5 | 27 | 32 | 2011 | 1 | 1 | 2 |
drop_columns = ['datetime','casual','registered']
bike_df.drop(drop_columns, axis=1,inplace=True)
from sklearn.metrics import mean_squared_error, mean_absolute_error

# log 값 변환 시 NaN등의 이슈로 log() 가 아닌 log1p() 를 이용하여 RMSLE 계산
def rmsle(y, pred):
    log_y = np.log1p(y)
    log_pred = np.log1p(pred)
    squared_error = (log_y - log_pred) ** 2
    rmsle = np.sqrt(np.mean(squared_error))
    return rmsle

# 사이킷런의 mean_square_error() 를 이용하여 RMSE 계산
def rmse(y,pred):
    return np.sqrt(mean_squared_error(y,pred))

# MSE, RMSE, RMSLE 를 모두 계산
def evaluate_regr(y,pred):
    rmsle_val = rmsle(y,pred)
    rmse_val = rmse(y,pred)
    # MAE 는 scikit learn의 mean_absolute_error() 로 계산
    mae_val = mean_absolute_error(y,pred)
    print('RMSLE: {0:.3f}, RMSE: {1:.3F}, MAE: {2:.3F}'.format(rmsle_val, rmse_val, mae_val))
로그 변환, 피처 인코딩, 모델 학습/예측/평가
from sklearn.model_selection import train_test_split , GridSearchCV
from sklearn.linear_model import LinearRegression , Ridge , Lasso

y_target = bike_df['count']
X_features = bike_df.drop(['count'],axis=1,inplace=False)

X_train, X_test, y_train, y_test = train_test_split(X_features, y_target, test_size=0.3, random_state=0)

lr_reg = LinearRegression()
lr_reg.fit(X_train, y_train)
pred = lr_reg.predict(X_test)

evaluate_regr(y_test ,pred)
RMSLE: 1.165, RMSE: 140.900, MAE: 105.924
def get_top_error_data(y_test, pred, n_tops = 5):
    # DataFrame에 컬럼들로 실제 대여횟수(count)와 예측 값을 서로 비교 할 수 있도록 생성.
    result_df = pd.DataFrame(y_test.values, columns=['real_count'])
    result_df['predicted_count']= np.round(pred)
    result_df['diff'] = np.abs(result_df['real_count'] - result_df['predicted_count'])
    # 예측값과 실제값이 가장 큰 데이터 순으로 출력.
    print(result_df.sort_values('diff', ascending=False)[:n_tops])

get_top_error_data(y_test,pred,n_tops=5)
      real_count  predicted_count   diff
1618         890            322.0  568.0
3151         798            241.0  557.0
966          884            327.0  557.0
412          745            194.0  551.0
2817         856            310.0  546.0
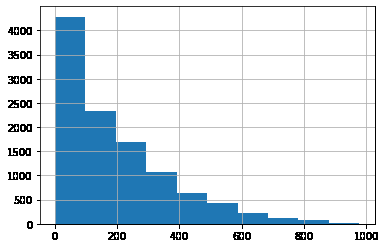
y_target.hist()
<AxesSubplot:>

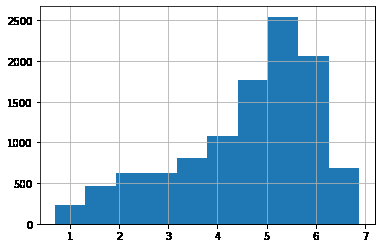
y_log_transform = np.log1p(y_target)
y_log_transform.hist()
<AxesSubplot:>

# 타겟 컬럼인 count 값을 log1p 로 Log 변환
y_target_log = np.log1p(y_target)

# 로그 변환된 y_target_log를 반영하여 학습/테스트 데이터 셋 분할
X_train, X_test, y_train, y_test = train_test_split(X_features, y_target_log, test_size=0.3, random_state=0)
lr_reg = LinearRegression()
lr_reg.fit(X_train, y_train)
pred = lr_reg.predict(X_test)

# 테스트 데이터 셋의 Target 값은 Log 변환되었으므로 다시 expm1를 이용하여 원래 scale로 변환
y_test_exp = np.expm1(y_test)

# 예측 값 역시 Log 변환된 타겟 기반으로 학습되어 예측되었으므로 다시 exmpl으로 scale변환
pred_exp = np.expm1(pred)

evaluate_regr(y_test_exp ,pred_exp)
RMSLE: 1.017, RMSE: 162.594, MAE: 109.286
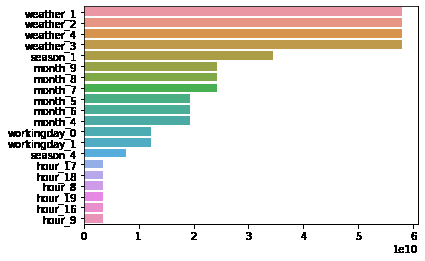
coef = pd.Series(lr_reg.coef_, index=X_features.columns)
coef_sort = coef.sort_values(ascending=False)
sns.barplot(x=coef_sort.values, y=coef_sort.index)
<AxesSubplot:>

# 'year', month', 'day', hour'등의 피처들을 One Hot Encoding
X_features_ohe = pd.get_dummies(X_features, columns=['year', 'month','day', 'hour', 'holiday',
                                              'workingday','season','weather'])
X_features
| season | holiday | workingday | weather | temp | atemp | humidity | windspeed | year | month | day | hour | |
|---|---|---|---|---|---|---|---|---|---|---|---|---|
| 0 | 1 | 0 | 0 | 1 | 9.84 | 14.395 | 81 | 0.0000 | 2011 | 1 | 1 | 0 |
| 1 | 1 | 0 | 0 | 1 | 9.02 | 13.635 | 80 | 0.0000 | 2011 | 1 | 1 | 1 |
| 2 | 1 | 0 | 0 | 1 | 9.02 | 13.635 | 80 | 0.0000 | 2011 | 1 | 1 | 2 |
| 3 | 1 | 0 | 0 | 1 | 9.84 | 14.395 | 75 | 0.0000 | 2011 | 1 | 1 | 3 |
| 4 | 1 | 0 | 0 | 1 | 9.84 | 14.395 | 75 | 0.0000 | 2011 | 1 | 1 | 4 |
| ... | ... | ... | ... | ... | ... | ... | ... | ... | ... | ... | ... | ... |
| 10881 | 4 | 0 | 1 | 1 | 15.58 | 19.695 | 50 | 26.0027 | 2012 | 12 | 19 | 19 |
| 10882 | 4 | 0 | 1 | 1 | 14.76 | 17.425 | 57 | 15.0013 | 2012 | 12 | 19 | 20 |
| 10883 | 4 | 0 | 1 | 1 | 13.94 | 15.910 | 61 | 15.0013 | 2012 | 12 | 19 | 21 |
| 10884 | 4 | 0 | 1 | 1 | 13.94 | 17.425 | 61 | 6.0032 | 2012 | 12 | 19 | 22 |
| 10885 | 4 | 0 | 1 | 1 | 13.12 | 16.665 | 66 | 8.9981 | 2012 | 12 | 19 | 23 |
10886 rows × 12 columns
X_features_ohe
| temp | atemp | humidity | windspeed | year_2011 | year_2012 | month_1 | month_2 | month_3 | month_4 | ... | workingday_0 | workingday_1 | season_1 | season_2 | season_3 | season_4 | weather_1 | weather_2 | weather_3 | weather_4 | |
|---|---|---|---|---|---|---|---|---|---|---|---|---|---|---|---|---|---|---|---|---|---|
| 0 | 9.84 | 14.395 | 81 | 0.0000 | 1 | 0 | 1 | 0 | 0 | 0 | ... | 1 | 0 | 1 | 0 | 0 | 0 | 1 | 0 | 0 | 0 |
| 1 | 9.02 | 13.635 | 80 | 0.0000 | 1 | 0 | 1 | 0 | 0 | 0 | ... | 1 | 0 | 1 | 0 | 0 | 0 | 1 | 0 | 0 | 0 |
| 2 | 9.02 | 13.635 | 80 | 0.0000 | 1 | 0 | 1 | 0 | 0 | 0 | ... | 1 | 0 | 1 | 0 | 0 | 0 | 1 | 0 | 0 | 0 |
| 3 | 9.84 | 14.395 | 75 | 0.0000 | 1 | 0 | 1 | 0 | 0 | 0 | ... | 1 | 0 | 1 | 0 | 0 | 0 | 1 | 0 | 0 | 0 |
| 4 | 9.84 | 14.395 | 75 | 0.0000 | 1 | 0 | 1 | 0 | 0 | 0 | ... | 1 | 0 | 1 | 0 | 0 | 0 | 1 | 0 | 0 | 0 |
| ... | ... | ... | ... | ... | ... | ... | ... | ... | ... | ... | ... | ... | ... | ... | ... | ... | ... | ... | ... | ... | ... |
| 10881 | 15.58 | 19.695 | 50 | 26.0027 | 0 | 1 | 0 | 0 | 0 | 0 | ... | 0 | 1 | 0 | 0 | 0 | 1 | 1 | 0 | 0 | 0 |
| 10882 | 14.76 | 17.425 | 57 | 15.0013 | 0 | 1 | 0 | 0 | 0 | 0 | ... | 0 | 1 | 0 | 0 | 0 | 1 | 1 | 0 | 0 | 0 |
| 10883 | 13.94 | 15.910 | 61 | 15.0013 | 0 | 1 | 0 | 0 | 0 | 0 | ... | 0 | 1 | 0 | 0 | 0 | 1 | 1 | 0 | 0 | 0 |
| 10884 | 13.94 | 17.425 | 61 | 6.0032 | 0 | 1 | 0 | 0 | 0 | 0 | ... | 0 | 1 | 0 | 0 | 0 | 1 | 1 | 0 | 0 | 0 |
| 10885 | 13.12 | 16.665 | 66 | 8.9981 | 0 | 1 | 0 | 0 | 0 | 0 | ... | 0 | 1 | 0 | 0 | 0 | 1 | 1 | 0 | 0 | 0 |
10886 rows × 73 columns
# 원-핫 인코딩이 적용된 feature 데이터 세트 기반으로 학습/예측 데이터 분할.
X_train, X_test, y_train, y_test = train_test_split(X_features_ohe, y_target_log,
                                                    test_size=0.3, random_state=0)

print(X_train.shape)
# 모델과 학습/테스트 데이터 셋을 입력하면 성능 평가 수치를 반환
def get_model_predict(model, X_train, X_test, y_train, y_test, is_expm1=False):
    model.fit(X_train, y_train)
    pred = model.predict(X_test)
    if is_expm1 :
        y_test = np.expm1(y_test)
        pred = np.expm1(pred)
    print('###',model.__class__.__name__,'###')
    evaluate_regr(y_test, pred)
# end of function get_model_predict

# model 별로 평가 수행
lr_reg = LinearRegression()
ridge_reg = Ridge(alpha=10)
lasso_reg = Lasso(alpha=0.01)

for model in [lr_reg, ridge_reg, lasso_reg]:
    get_model_predict(model,X_train, X_test, y_train, y_test,is_expm1=True)
(7620, 73)
### LinearRegression ###
RMSLE: 0.590, RMSE: 97.687, MAE: 63.381
### Ridge ###
RMSLE: 0.590, RMSE: 98.529, MAE: 63.893
### Lasso ###
RMSLE: 0.635, RMSE: 113.219, MAE: 72.803
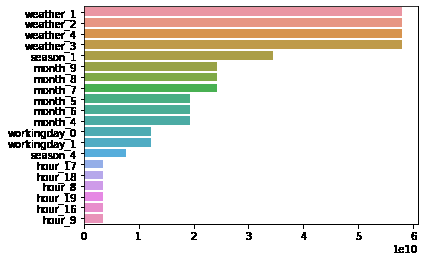
coef = pd.Series(lr_reg.coef_ , index=X_features_ohe.columns)
coef_sort = coef.sort_values(ascending=False)[:20]
sns.barplot(x=coef_sort.values , y=coef_sort.index)
<AxesSubplot:>

from sklearn.ensemble import RandomForestRegressor, GradientBoostingRegressor
from xgboost import XGBRegressor
from lightgbm import LGBMRegressor

# 랜덤 포레스트, GBM, XGBoost, LightGBM model 별로 평가 수행
rf_reg = RandomForestRegressor(n_estimators=500)
gbm_reg = GradientBoostingRegressor(n_estimators=500)
xgb_reg = XGBRegressor(n_estimators=500)
lgbm_reg = LGBMRegressor(n_estimators=500)

for model in [rf_reg, gbm_reg, xgb_reg, lgbm_reg]:
    # XGBoost의 경우 DataFrame이 입력 될 경우 버전에 따라 오류 발생 가능. ndarray로 변환.
    get_model_predict(model,X_train.values, X_test.values, y_train.values, y_test.values,is_expm1=True)
### RandomForestRegressor ###
RMSLE: 0.354, RMSE: 50.183, MAE: 31.053
### GradientBoostingRegressor ###
RMSLE: 0.330, RMSE: 53.329, MAE: 32.740
### XGBRegressor ###
RMSLE: 0.342, RMSE: 51.732, MAE: 31.251
### LGBMRegressor ###
RMSLE: 0.319, RMSE: 47.215, MAE: 29.029
의문점
- feature 데이터들에 대해 정규화 작업을 해주지 않았는데 회귀 계수값을 시각화해서 어떤 feature가 중요한가를 가리는게 의미가 있는건가?
PREVIOUS경제